

In the previous story, we saw an overview of elastic stack observability and a basic overview of it.
Let's get deeper today into what is inside elastic observability and what the actual feature looks like, whenever comes word observability comes into your mind, you look for what running into your hosts like process, CPU utilization, memory utilization, network utilization so they called as
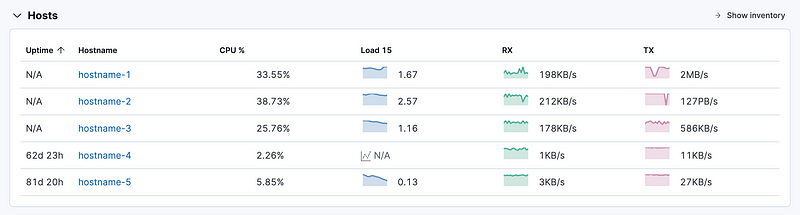
Infrastructure monitoring:-
On the Observability Overview page, the Hosts table shows your top hosts with the most significant resource footprints. This metrics help you evaluate host efficiency and determine if resource consumption is affecting hosts or not.
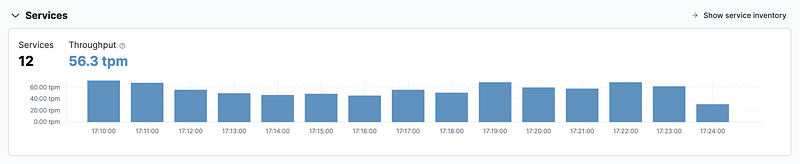
Application Performance Monitoring(APM):-
As Word says, instrument your application and collect performance data and errors at runtime by installing APM agents like Java, GO, dot NEt and many more languages.
On the observability Overview Page, the Services chart shows the total number of services running across the environment and the graph will show you the total number of transactions per minute (TPM) these are captured by elastic APM agent.
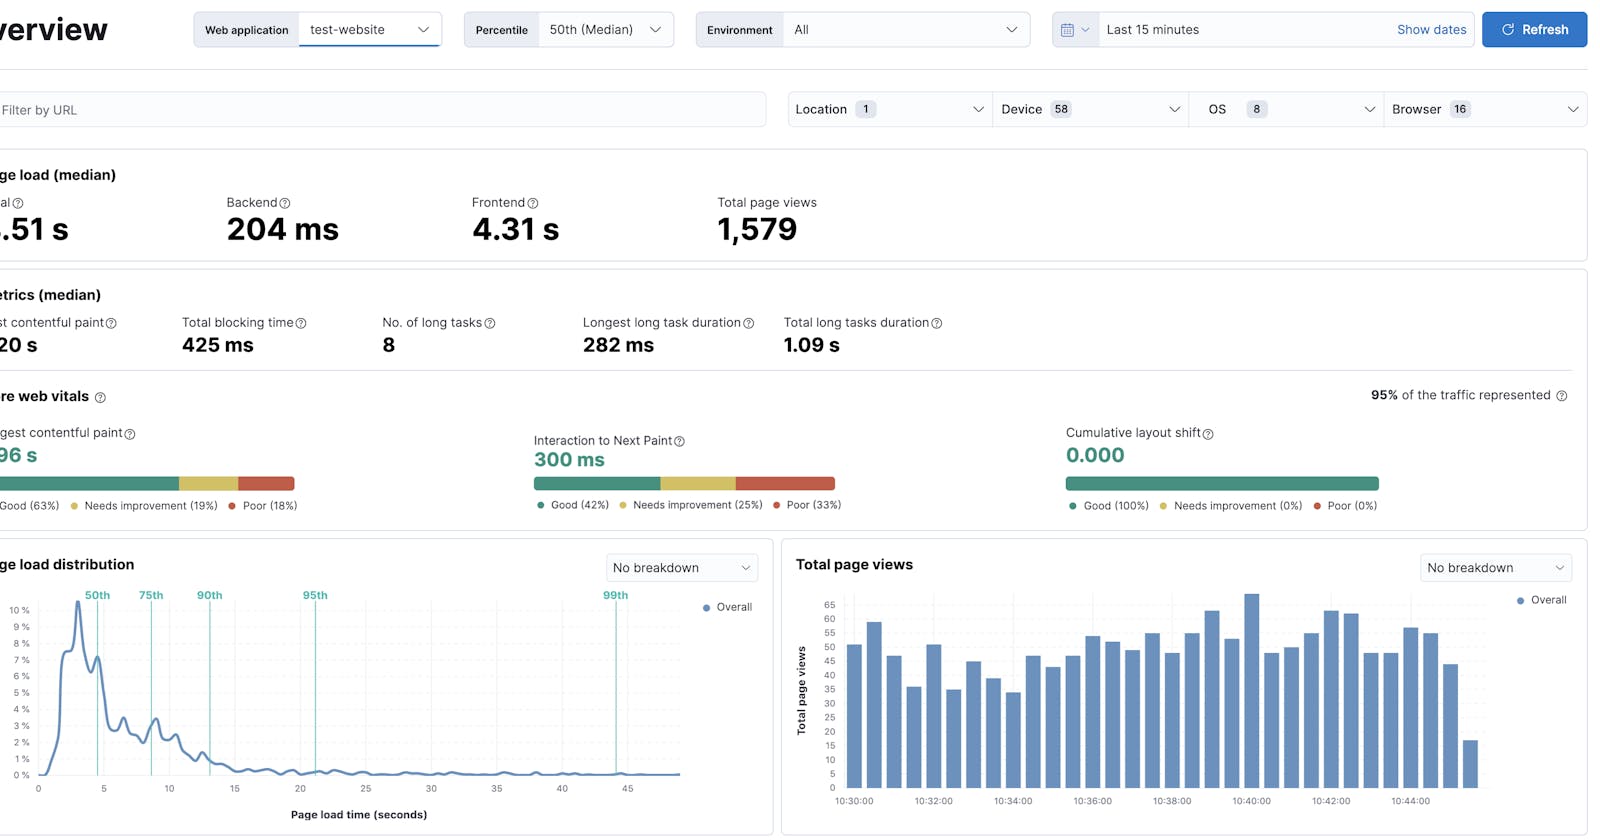
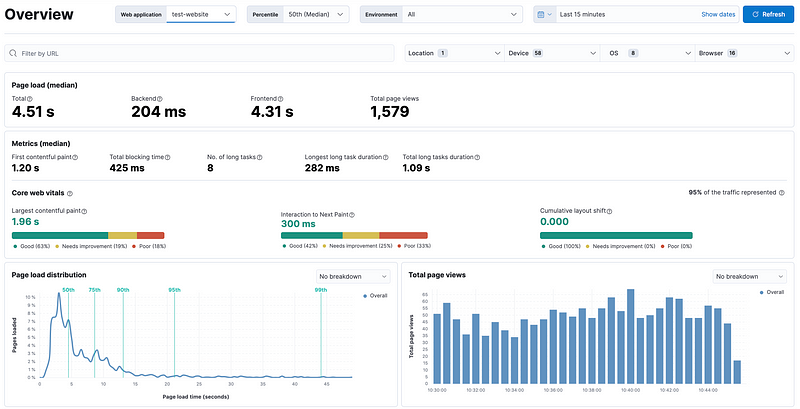
Real User Monitoring (RUM):-
Don’t go for short word meaning 🍷. Jokes apart RUM is used to analyse the performance of web applications with user data, how much time takes to load the page, from which region people are interacting with our web application, how many views on your web application, which web pages are most accessible by users and most important matter is user experience the web application. With the help of RUM, you can tune and perform faster in terms of web apps. Remember, RUM agents can be used with frontend language (Javascript).
So there is another monitoring which people are aware of which is o or 1 yeah, you guessed correctly! synthetic monitoring but Elastic has introduced two types, i.e. uptime monitoring & synthetic monitoring.
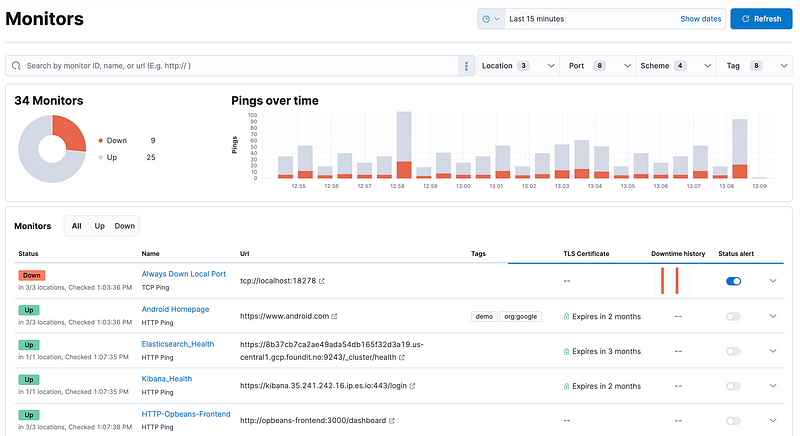
Uptime Monitoring:-
Uptime monitoring is coming from their beat terminology, which is based on their product heartbeat. I will explain to you shortly its daemon which is going to install on your node and then with the help of the rule yaml file it will send data to Elastic Cloud which is a managed stack or self-hosted Elasticsearch which is running on your infrastructure and then it will show the results on Kibana app which is your app is on or off 😄

So Kibana will show you this:-
Uptime monitoring rule will look this
heartbeat.monitors:
- type: http
  id: service-status
  name: Service Status
  service.name: my-apm-service-name
  hosts: ["http://localhost:80/service/status"]
  check.response.status: [200]
  schedule: '@every 5s'
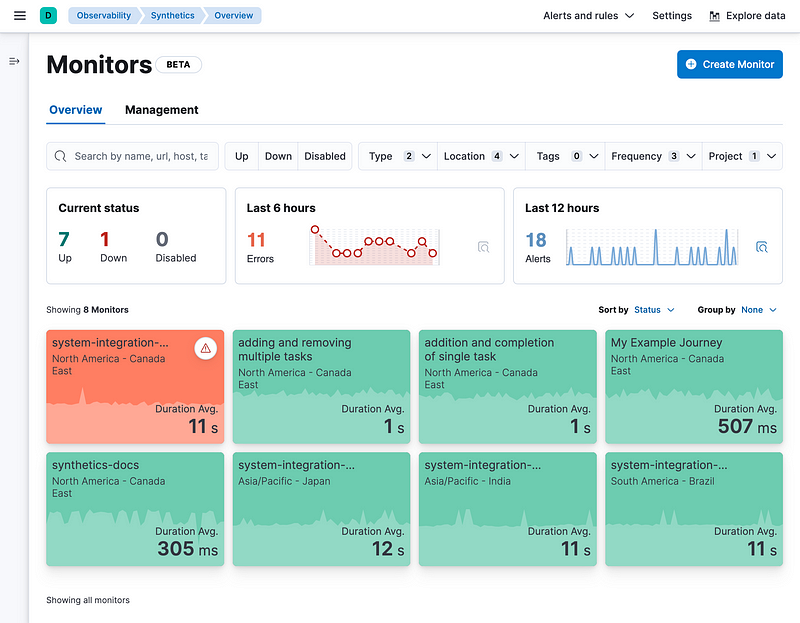
Synthetic Monitoring:-
Another one is a better version of uptime monitoring. I can say which includes both lightweight monitors and browser monitors which means it will start the browser open the web page, go to the cart, and purchase some items, before the user reports an issue, Kibana will give you an alert that this is not working as expected so people can take a look.